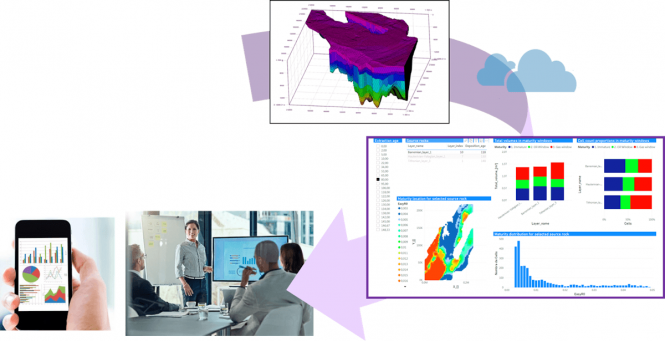

Analyzing geomodels and physical simulation results can be tedious and often involve complex post-processing, which decreases interactivity and hinders collaborative work.
Our objectives are to facilitate the exploration of modelling results in situations of fast decision-making or when the modelling software is not directly available (meetings, business trips, home office…).
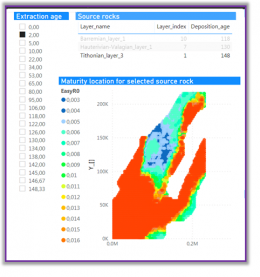
In this demonstration project, we used the Microsoft POWER BI solution. First we configured it to access basin simulation results previously exported as column-based files. Then we designed dedicated data visualization dashboards to highlight the statistical trends relevant in a petroleum exploration context.
Feedbacks from users underlined the time saved in post-processing tasks and the interactivity gained in business presentations in comparison with traditional slides shows.
This methodology could be applied for other geomodelling contexts such as reservoir engineering, with different dashboarding solutions (Qlik Sense, Tableau…), or to compare several models together. Besides it could be integrated with natural-language queries and web-based visualisation of 3D geomodels.


